IMPORTANT UPDATE: Congress has changed the ACA premium subsidy amounts for 2021-2025. The marginal tax rates resulting from the phase-out of these subsidies have also changed. See this post for a graph comparing the old marginal rates with the new marginal rates. In a nutshell, the rates have gone down for incomes below 300% of the poverty level, and have gone up at higher incomes. The basic premise behind the post below still applies.
FURTHER UPDATE: As of mid-2025, the temporary changes in premium subsidy formulas from 2021 seem likely to sunset. This will cause the graphs from the original post below to be more-or-less accurate again, minus annual inflation adjustments. I may post an update with inflation adjustments in the future.
ORIGINAL POST BELOW…
In a recent thread on the MMM forums, there was a discussion about how the phase-out of ACA premium subsidies can act as a second parallel tax system to the standard federal income tax. I had always been aware of this in theory, but had previously dismissed it as a pretty minor factor for planning because the percentage of your MAGI you’ll pay for insurance after subsidies is fixed at a relatively low rate (ranging from roughly 2% of MAGI at the low end of the income scale to a bit less than 10% at the upper end of the subsidy-eligible range).
What I failed to consider was that as your income increases and the percentage of income you owe for the reference insurance plan also increases, this new percentage is applied to your entire income, not just the marginal income. This causes the marginal rate of subsidy phase-out to be greater than the percentage of MAGI now owed. In fact in many cases the marginal rate is in excess of 15%!
See the graph below for how this works.
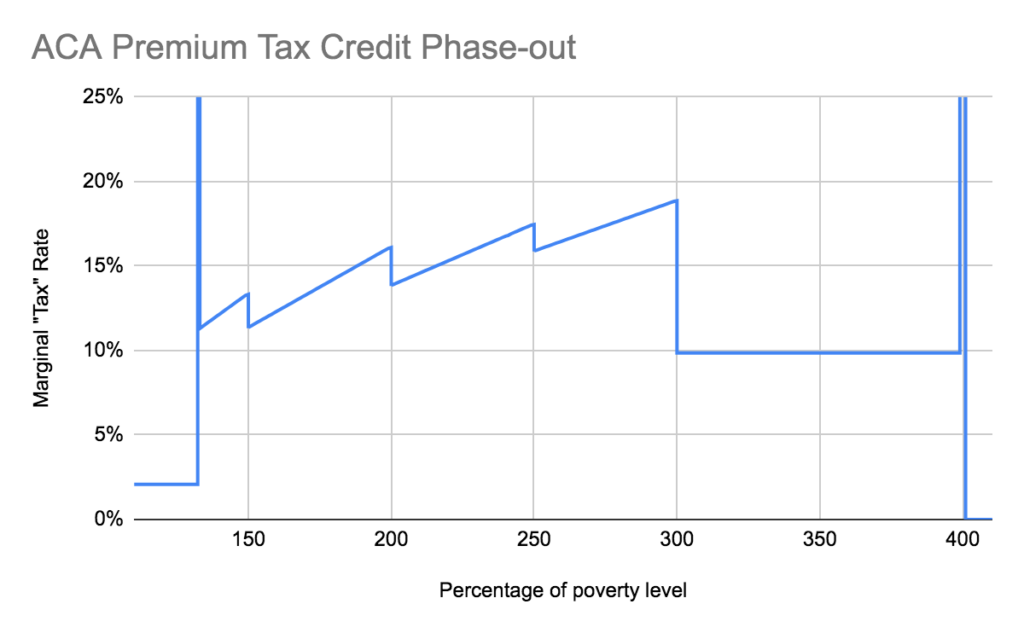
Those big vertical lines represent cliffs at 133% of the poverty level (where there’s a sharp jump from 2.08% of MAGI to 3.11% of MAGI) and at 400% of the poverty level (where premium subsidies go away completely). Between the cliffs there’s a pretty big range where the marginal rate is right around 15%. Above 300% of the poverty level the applicable percentage of income is fixed at 9.86%, so that’s also the marginal rate that applies in this range.
How does this look when added on to the standard federal income tax brackets in early retirement?
Example 1: Single person
Let’s start with a pretty simple example, of a single person using the Roth conversion ladder to access their IRA funds during early retirement. All of their income is generated using this method. They claim the standard deduction and aren’t eligible for any tax credits besides the ACA premium assistance.

The blue line in this graph is exactly the same as in the first graph, representing the marginal rate for phase-out of the ACA premium tax credit for a single-person household.
The red line is federal income tax: 0% below the standard deduction, then a 10% bracket, 12% bracket, and 22% bracket. The yellow line is the sum of the two. To the right of the subsidy cliff the blue line goes to zero, so the red and yellow lines are identical at that point.
What we can see from this graph is that the total marginal rate for this individual is in excess of 20% for the entire ACA phase-out range, and in excess of 25% for a large chunk of it.
How about a single person drawing down their taxable investment account, getting all their income from dividends and long-term capital gains?
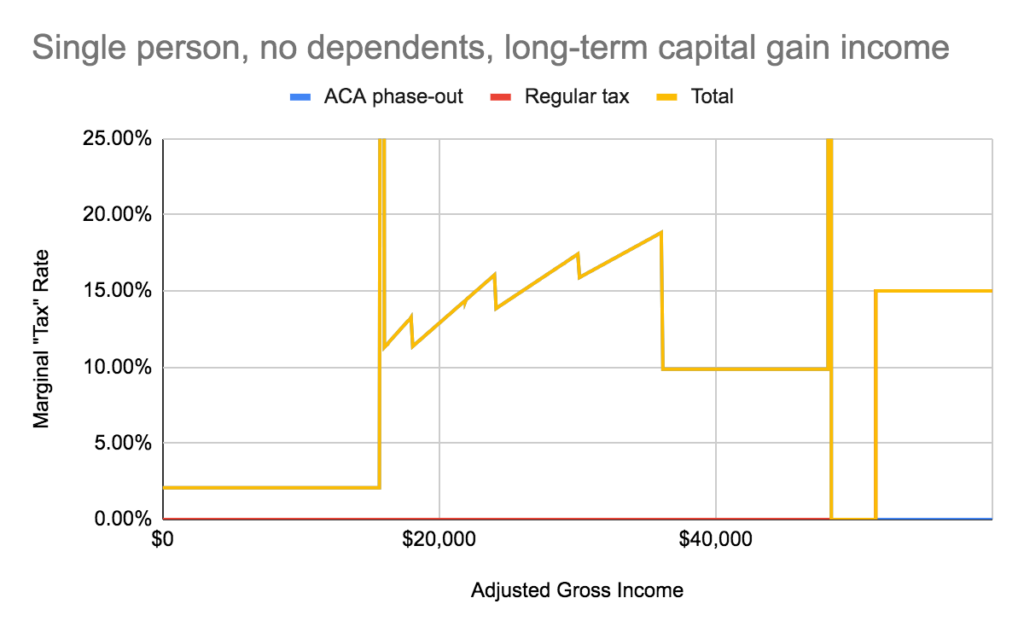
In this case the red and blue lines are hardly visible at all. During the ACA phase-out range the tax rate for long-term gains is 0%, so the yellow line overlaps the blue line. After that there’s no more ACA subsidy to phase out so the yellow line overlaps the red line.
I think this graph helps rebut the somewhat common question about whether Roth contributions make sense when taxable investments have a 0% income tax rate at lower income levels. If it’s tax-free either way, why tie the money up in a Roth IRA, right?
Well, if you’re planning to take ACA subsidies, it’s not tax-free either way. You’ll be paying for those “tax-free” capital gains in the form of lower ACA tax credits, while withdrawals of your Roth principal don’t count toward your MAGI and therefore don’t affect your ACA tax credit in the slightest.
The graph of capital gains income above is basically the same for other family sizes: only ACA phaseouts count toward the marginal rate in the phase-out range, then there’s a period of truly zero tax after the ACA cliff, then the 15% capital gains rate starts to apply later. The income levels stretch out based on family size, but the general form of the graph stays the same.
Example 2: Family of four
Now we’ll look at a family of four: a married couple with two kids under the age of 17. All of their income comes from Roth conversions. They claim the standard deduction, child tax credit, ACA premium tax credit, and nothing else.
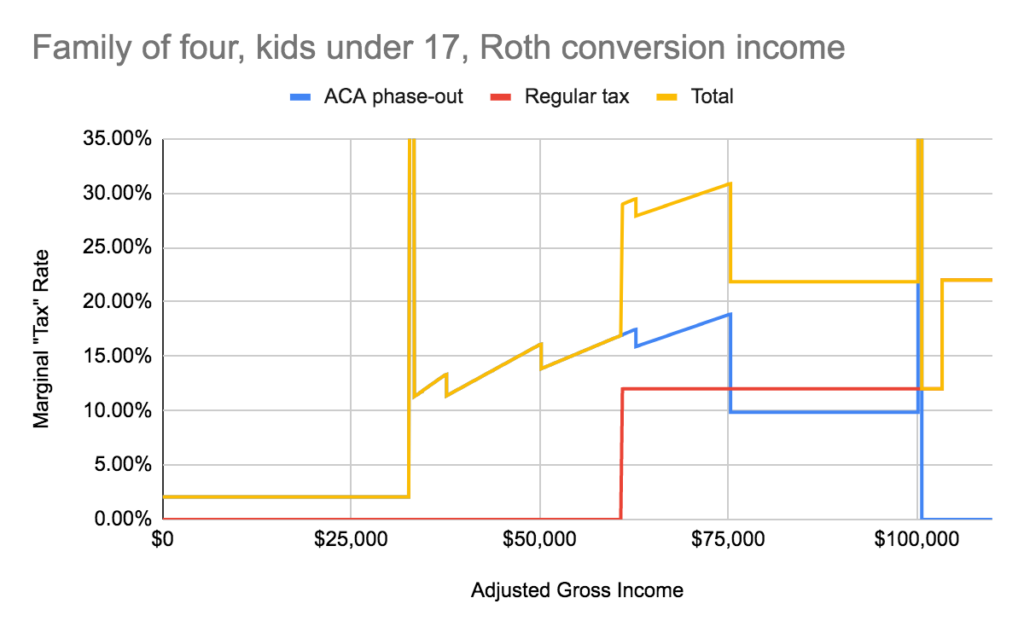
This family has a pretty big range (up to nearly $61,000 in gross income) where the child tax credit erases their federal income tax liability, so only the ACA phase-out contributes to their total marginal rate. After that it looks pretty similar to the single-person example, with total rates around 30% up to 300% of the poverty level, then dropping down to 22% until the subsidy cliff.
What happens as the kids grow up? Once they hit age 17 they’re no longer eligible for the $2,000 child tax credit, but as long as they remain dependents of their parents there’s a $500 “credit for other dependents.” If both kids fall into this situation, it looks something like this:

This is starting to look a lot more like the graph for a single person. Not quite all of the ACA subsidy phase-out range has total marginal rates in the 20-30% range, but it’s pretty close.
Fast forward a few years, the kids finish school, earn their own money, and stop being tax dependents. What happens then? The parents will still be paying taxes as a married couple, and will now be using the two-person household poverty level for their ACA subsidies.

This graph has an x-axis at the same scale as the previous graphs for a four-person family. Notice that the ACA phase-out range has moved over to the left and compressed into a smaller range. This couple will need to sharply reduce their income if they want to keep paying the same amount for health insurance as before their children moved on, and maybe to keep getting any ACA subsidies at all. This is happening at the same time as they’re getting older and facing higher premium costs if they were to lose their subsidies.
Conclusions
I know that this sequence of graphs has caused me to reconsider my family’s long-term tax strategy. I had previously thought it best to focus on spending down taxable investments early on in FIRE, then focus more on Roth conversions later on.
Now that I see how the child tax credit gives us a pretty big amount of space where Roth conversions are taxed the same as capital gains, but only until the kids turn 17, perhaps accelerating some of those Roth conversions would make sense in order to build up some more basis in those accounts and allow us to more easily reduce our income when we have no more dependents to declare.
I’m also starting to think the standard advice in the FIRE community to prioritize pre-tax retirement accounts over Roth while in the accumulation phase may be misguided. The assumption is that someone who spends a fraction of their income while working will be very likely to retire into a lower tax rate. As we can see in these graphs that isn’t such a sure thing when you also consider the ACA subsidy phaseout as part of your marginal tax rate in retirement.
Someone earning enough to hit the 35% bracket during their career would still be seeing a pretty definite win by deferring a bunch of taxable income until retirement. For people even in the 24% bracket while working, we can see plenty of relatively low retirement incomes where you’ll be paying more than that.
Of course if you would rather buy insurance from a private carrier instead of relying on Medicaid you’ll need to come up with some level of income that counts toward MAGI in retirement. But maybe the best thing for most folks with relatively normal salaries to do is to save just enough pre-tax to hit the very low end of the ACA subsidy range each year in retirement and go with Roth for the rest.
What do you think? I’d love to hash this out more in the comments.